
Figure 9.
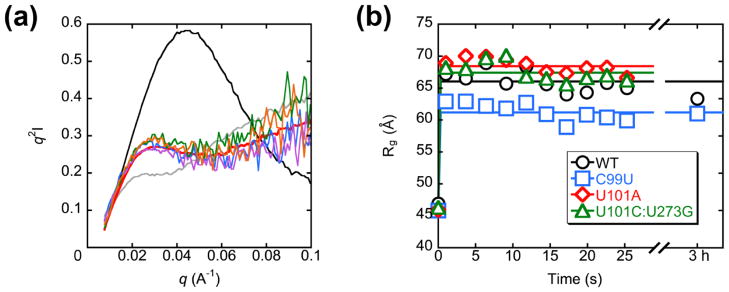
Monitoring global unfolding of native ribozyme by SAXS. (a) Kratky plots of the wild-type ribozyme at 2 °C and 50 mM Na+ after free Mg2+ removal by EDTA addition. Unfolding times are 1 s (blue), 6 s (purple), 15 s (green), and 25 s (orange) after addition of EDTA. Also shown for comparison are plots of the native ribozyme (black), unfolded ribozyme (gray), and a 3 hr time point after EDTA-mediated Mg2+ removal (red). (b) Time course of ribozyme expansion at 2 °C and 50 mM Na+. Rg values are plotted against time after addition of EDTA.