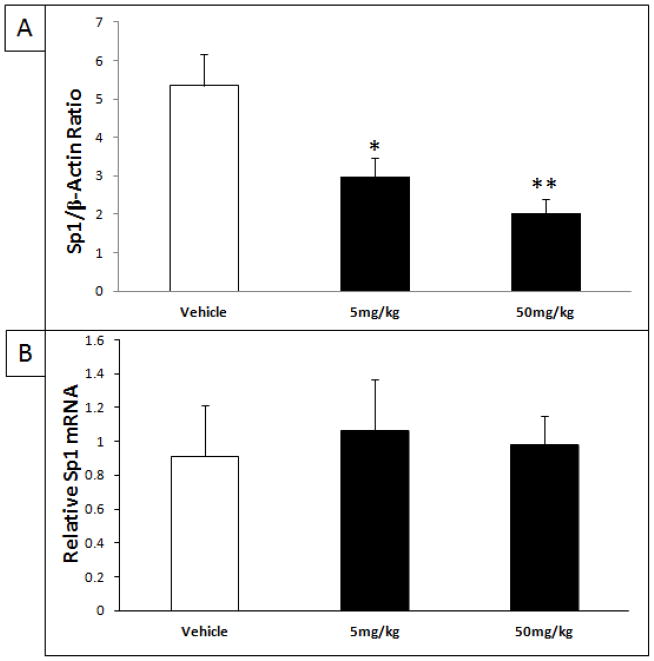
Fig. 6. Reduction of SP1 protein levels in the brain after treatment with tolfenamic acid.
Tolfenamic acid was administered by oral gavage daily for 34 days. See the methods section for details. A) Western blot analysis of cortical SP1 levels as a ratio of the house-keeping protein β-actin after treatment with 5 and 50 mg/kg/day of tolfenamic acid for 34 days. B) Cortical Sp1 mRNA levels determined by Real-Time PCR. “*” Indicates that values are significantly different from vehicle, as determined by one-way ANOVA analysis with Tukey-Kramer post-hoc test to compare all pairs of columns (*p<0.05, **p<0.01), obtained using GraphPad InStat 3 software.

