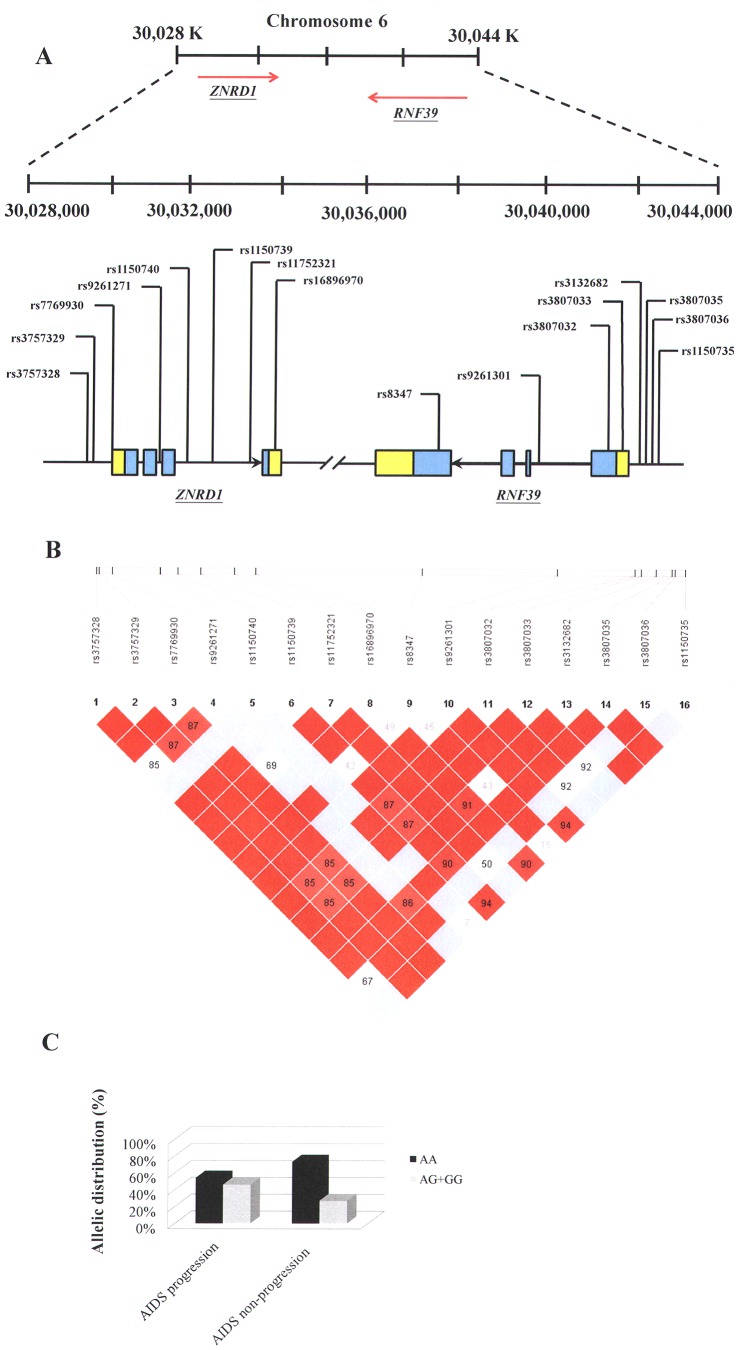
Figure 1. Single nucleotide polymorphisms (SNPs) analyzed and the linkage disequilibrium (LD) pattern of the ZNRD1 and RNF39 genes used in this study.
A: Genomic location of SNPs present on chromosome 6p21. B: Linkage disequilibrium (LD) blocks in the ZNRD1 and RNF39 genes, estimated by using HAPLOVIEW software. Pairwise D’ values (%) are indicated in squares; red indicates linkage disequilibrium (D’ = 1, logarithm of odds (LOD) ≥2); blue indicate evidence of recombination (D’ = 1, LOD<2). C: Allelic distribution (%) of the significant SNP (rs16896970) in the AIDS progression and non-progression groups.

