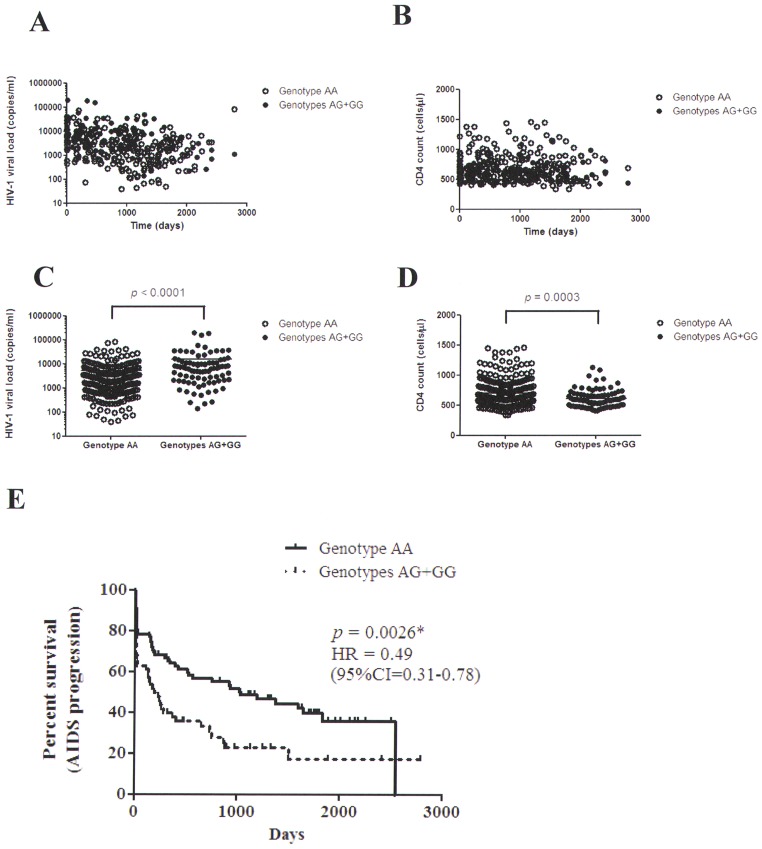
Figure 2. Comparison of HIV-1 viral loads, CD4 counts and percent survivial analysis between the significant SNP (rs16896970) genotypes.
A: Measurements of HIV-1 viral load after infection were shown between the AA and AG+GG genotypes. B: Measurements of CD4 count after infection were shown between the AA and AG+GG genotypes. C: Analysis between HIV-1 viral load and the AA and AG+GG genotypes (p<0.0001; the unpaired Student t test). D: Analysis between CD4 count and the AA and AG+GG genotypes (p<0.0001; the unpaired Student t test). E: Kaplan-Meier survival analysis was performed to assess the difference between the AA and AG+GG genotypes (p = 0.0026, log-rank test).

