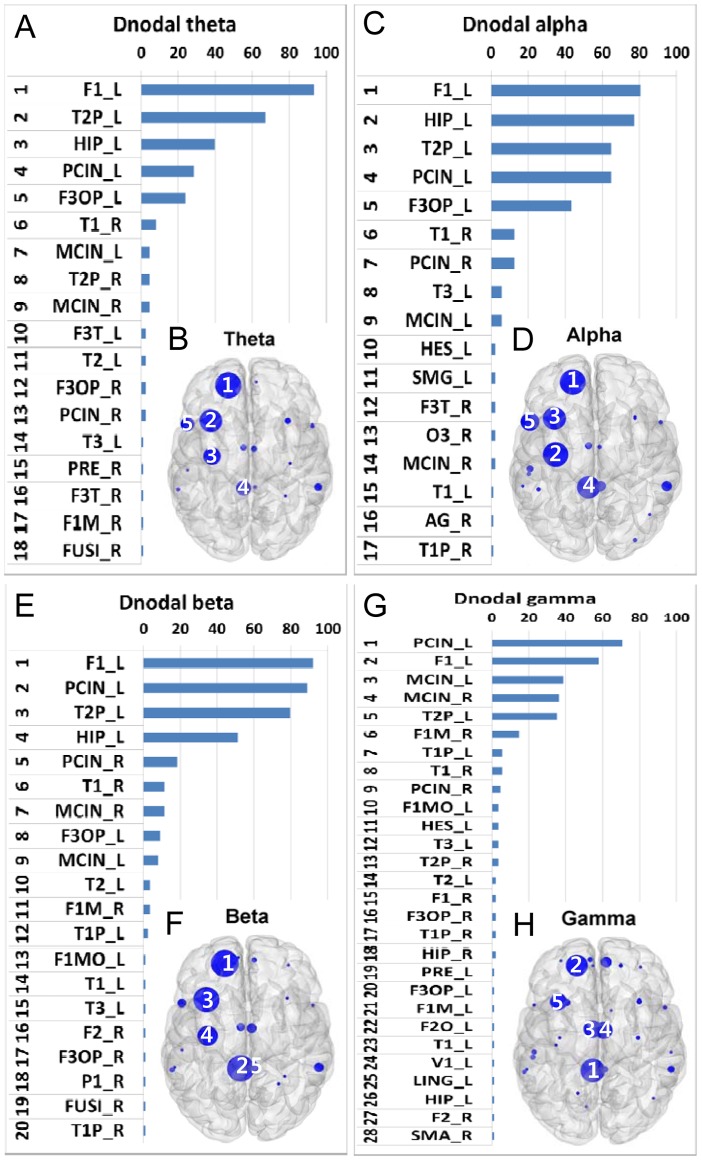
Figure 1. Hubs with high degree.
Hubs based on the aggregated ranking percent of each node across 88 participants and their topological maps projected into a cortical surface at the theta (A and B), alpha (C and D), beta (E and F), and gamma (G and H) bands obtained from Dnodal estimation. The ranked distribution of aggregated ranking percent included only nonzero percent nodes, and the numbers in the topological maps denote the top 5 hub locations. Abbreviated notations for each node can be found in Table 1, and ‘_L’ and ‘_R’ denote the left and right hemisphere, respectively, at each node. The horizontal axes in A, C, E, and G indicate percentage (%).

