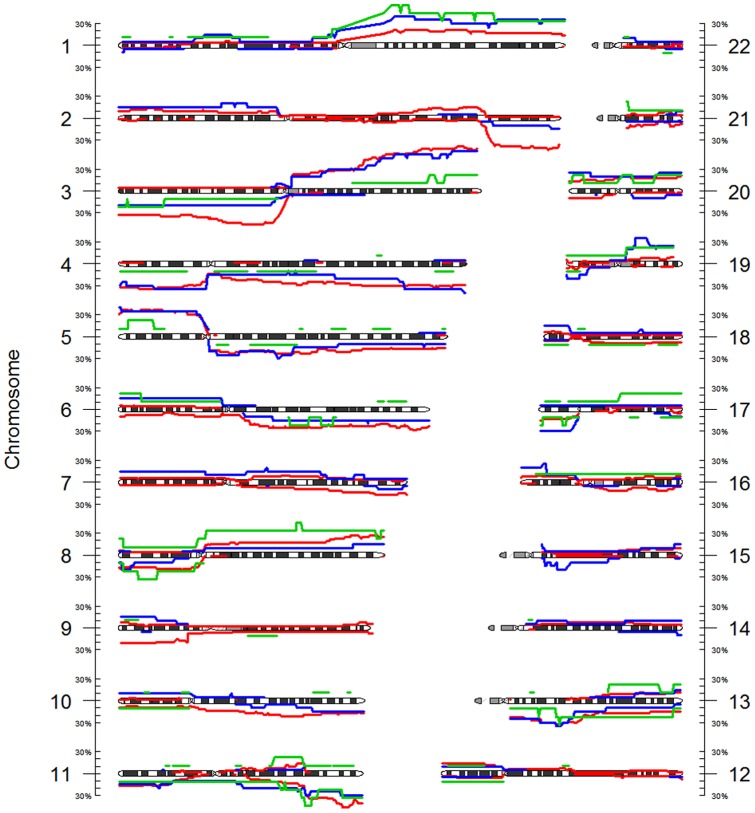
Figure 5. Frequency of gains and losses in histological groups.
Gains are depicted on top of the ideograms, while losses are depicted below. Red: squamous tumors, green: adenocarcinoma + mixed type, blue: adenosquamous tumors. Adenocarcinoma and mixed type were combined because of the low numbers of samples in these groups.

