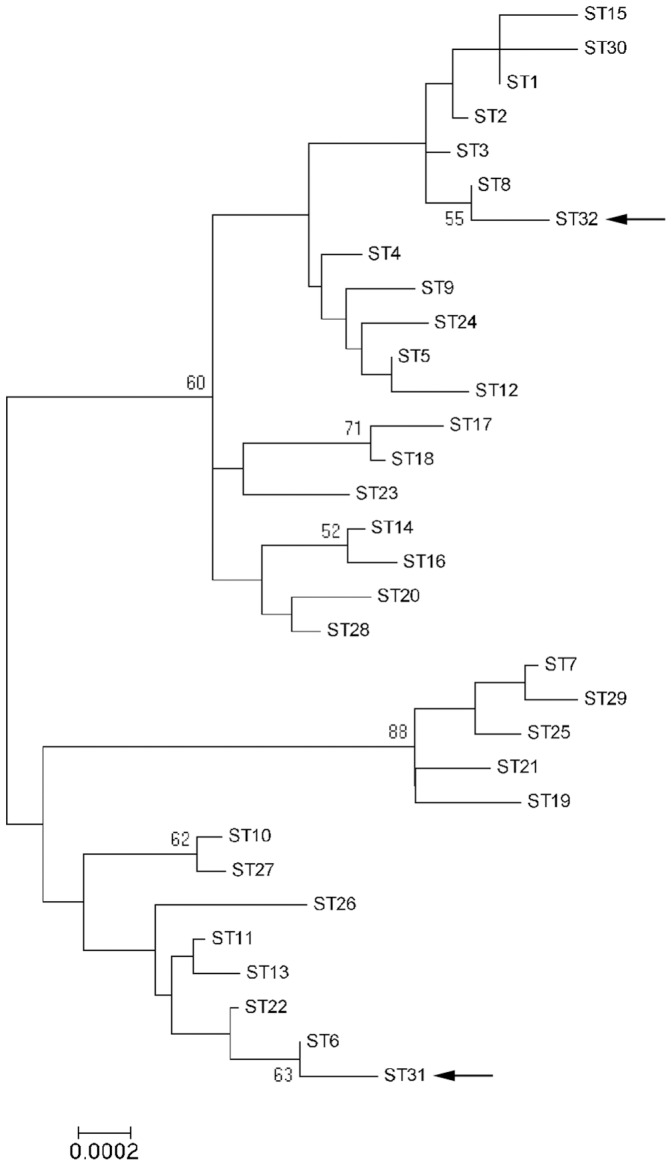
Figure 1. Dendrogram of the B. henselae MLST STs.

Concatenate sequences of the 30 STs (3397–3398 pb) present in the MLST database (http://bhenselae.mlst.net) and the two new STs identified in this study (black arrows) were analyzed with MEGA5 software. The best nucleotide substitution model was Jukes-Cantor+I (rate for invariant sites), which was applied to build the dendrogram with the maximum likelihood method. Bootstrap values of less than 50% have been deleted from the tree. Scale bar denotes substitutions per nucleotide position.
