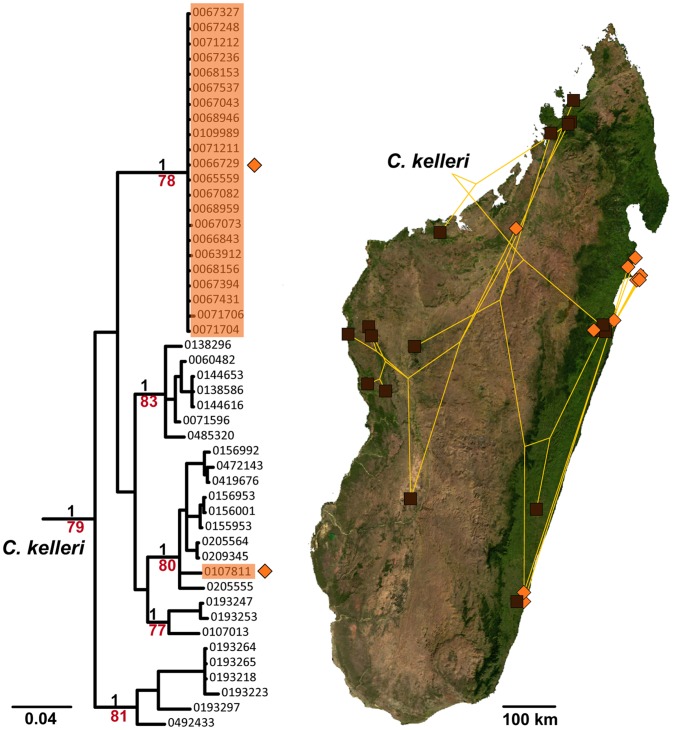
Figure 4. Mitochondrial phylogeny of C. kelleri with respect to variation and distribution data.
Results of Bayesian inference based on 578 bp of COI as shown in Fig. 1, but showing only the C. kelleri clade. Support values in black represent posterior probabilities (pp), those in red ML bootstrap values, values pp<0.96 and bootstrap<60 are not shown; scalebar shows nucleotide changes per base pair. On the phylogeny, orange-shaded specimens indicate the yellow form of C. kelleri, unshaded specimens belong to the brown form. On the map of Madagascar, the yellow form is indicated by orange diamonds and the brown form by squares; the lines connecting the markers represent the phylogeny as plotted on the map with CARTOGRAPHER [16].

