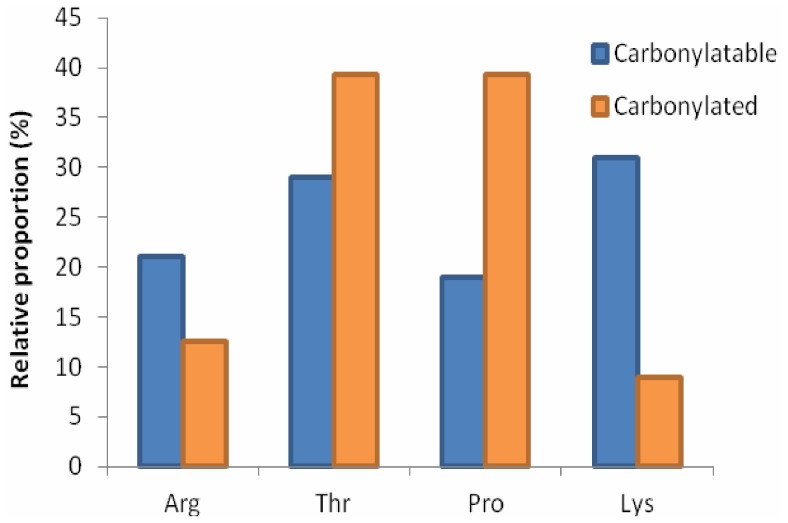
Figure 3. Relative proportion of R, T, P and K residues that were carbonylated.
Proportion of each residue as a fraction of the total R+T+P+K content in the 62 carbonylated proteins P. angustum (blue), and relative proportion of those residues that were carbonylated (orange). Comparing the percentage that each residue represents versus the percentage that was experimentally determined to be carbonylated highlights the disproportionately high level of carbonylation of P residues.

