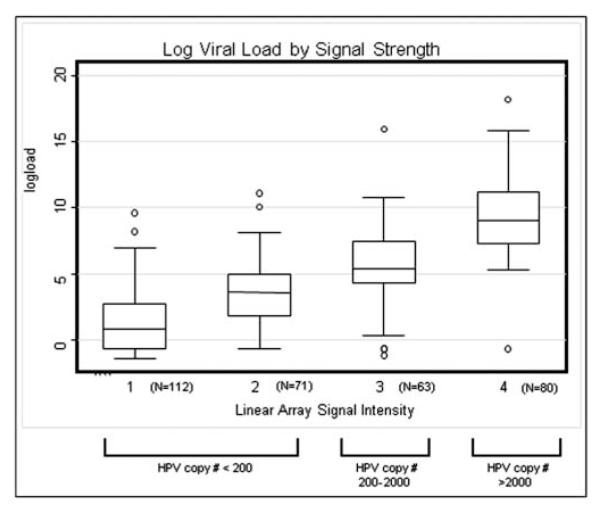
Figure 1.

Box-plot of the distribution of log viral loads for HPV 16, 18, 31, 33, 35 and 52 by their corresponding Linear Array assay band intensities for all infections tested by quantitative PCR. The plot depicts the mean and IQR of the data, with whiskers representing the highest and lowest datum still within 1.5 IQR of the upper and lower quartile and points representing any observations outside this range. The average detected viral copy number (SD) in 5 μl of solution for samples with (A) signal strength=1 was 4.6 (12.4) copies. (B) signal strength=2 was 35.9 (15.3) copies. (C) signal strength=3 was 275.9 (21.8) copies. (D) signal strength=4 was 11 384.4 (19.9).
