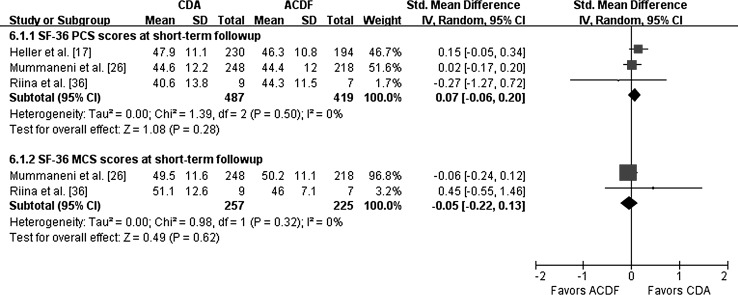
Fig. 6.
The forest plot for SF-36 at short-term followup shows no difference in PCS and MCS scores between the cervical disc arthroplasty group and the fusion group. IV = inverse variance; ACDF = cervical decompression and fusion; CDA = cervical disc arthroplasty; PCS = physical health surveys; MCS = mental health surveys.

