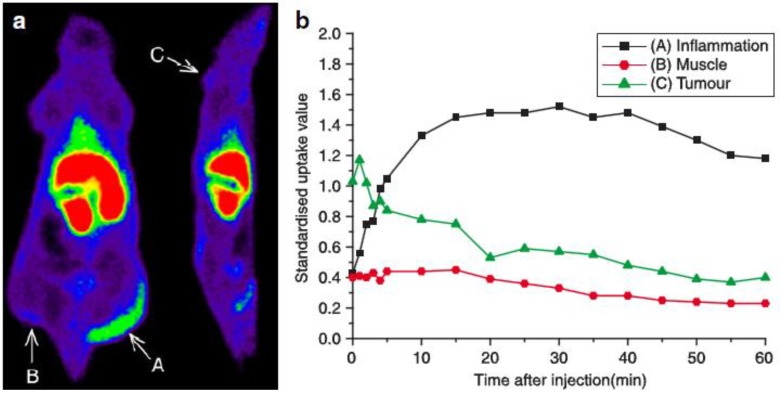
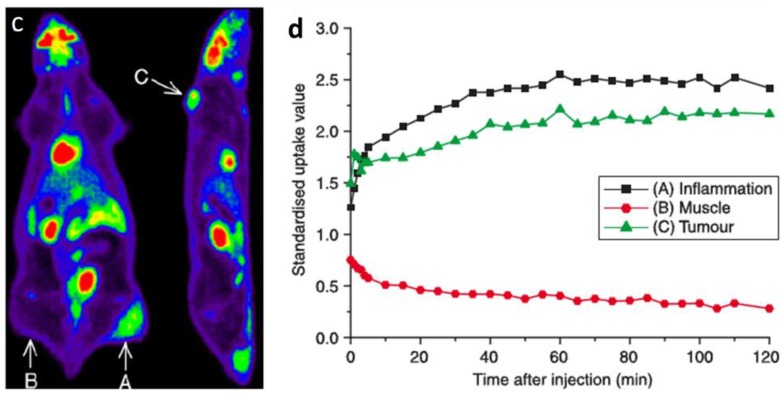
Figure 7.
68Ga-DOTAVAP-P1 (a, b) and 18F-FDG (c, d) PET imaging of mice with BxPC-3 tumor inoculation and turpentine induced inflammation. (a) 68Ga-DOTAVAP-P1 uptake is clearly seen at the site of inflammation (arrow A) but not in the muscle (arrow B) or the tumor (arrow C). (b) Time-activity curve (TAC) of 68Ga-DOTAVAP-P1 uptake in the inflammation site, muscle and tumor. (c) 18F-FDG uptake is clearly seen at the site of inflammation (arrow A) as well as the tumor (arrow C). (d) TAC of 18F-FDG uptake in the inflammation site, muscle, and tumor (Autio, 2010 24).


