
Figure 3.
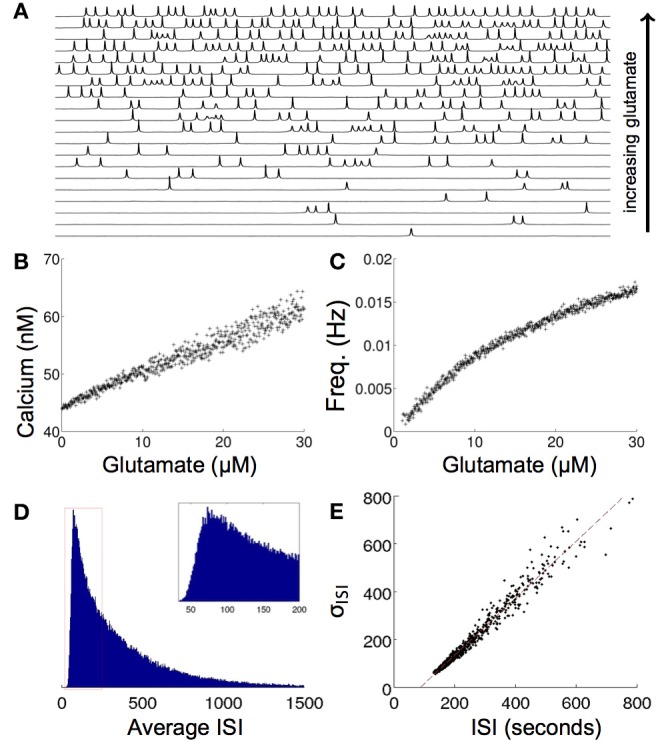
Effects of increasing glutamate concentration on a single modeled astrocyte. (A) Increasing glutamate induces spontaneous oscillations in a single cell. (B,C) As the level of applied glutamate increases, both the baseline calcium between excitation and the frequency of excitation increase. (D) A histogram of the ISI of one run for 5x10⁷ s shows a poisson distribution of the ISI, as is predicted from stochastic intracellular modeling. (E) The σISI−ISIav plot of many runs of different glutamate concentrations (0–50 μM) shows a linear relationship as seen experimentally.