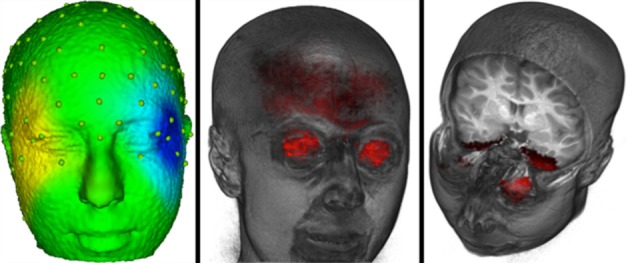
Figure 3.

The eye movement related source localization for one participant. The left panel shows a scalp potential map with the ICA component loadings of a putative ICA eye movement component for one participant. The center panel shows the eyeball sources. The right panel shows the current density from the cortical source analysis for the ICA component that is shown in the left panel.
