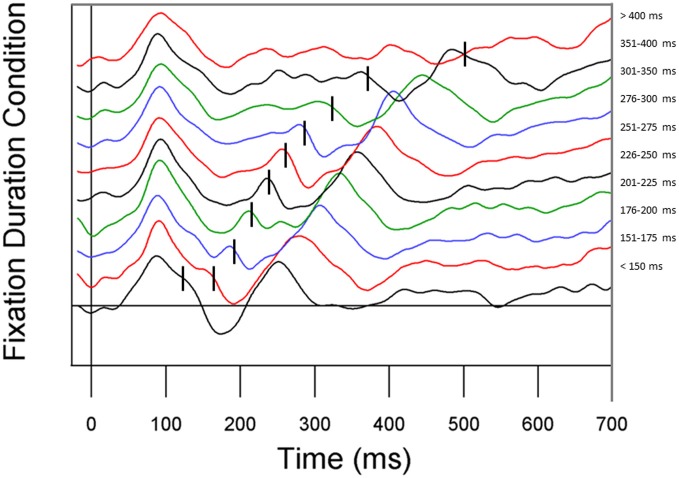
Figure 5.
ERP waveforms stratified by fixation duration. Fixation duration increases from the bottom line to the top line. From bottom to top, conditions represent all fixations less than 150 ms, 151–175 ms, 176–200 ms, 201–225 ms, 226–250 ms, 251–275 ms, 276–300 ms, 301–350 ms, 351–400 ms, and all fixations greater than 400 ms.

