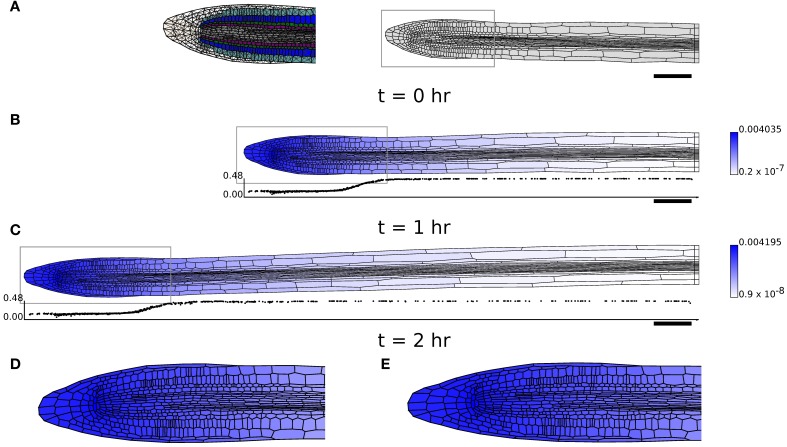
Figure 8.
Simulation of a growing Arabidopsis root apex. (B,C) Simulation results at t = 1 hr and t = 2 hr with initial geometry (A). Shading indicates cell growth inhibitor concentration (on a logarithmic scale); graphs below (B,C) show the expansion rate of the cells (hr−1), plotted at the x-position of the cell centroids. (D,E) The regions highlighted in gray in (B,C) in more detail. Triangulation of geometry has 8937 elements (see (A)). Simulation parameters are as in Table 1, except μaxial = 0.05 MPa μm hr, τ0axial = 0.1 MPa μm, μ1 = 0.3 MPa hr, τ0 = 0.1 MPa for (B,C) and μaxial = 0.5 MPa μm hr, τ0axial = 0.1 MPa μm, μ1 = 0.2 MPa hr, τ0 = 0.1 MPa for (D).

