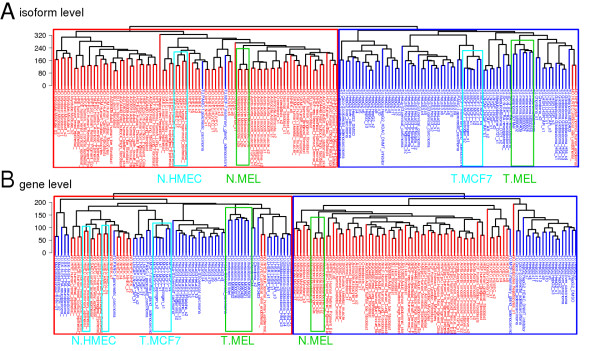
Figure 1.

Hierarchical clustering dendrograms of 160 datasets (73 oncogenic and 87 non-oncogenic) from cell lines of various tissue origins, using expression estimates of (A) 87,345 transcripts and (B) 27,063 genes. The top 76% of genes/transcripts with the highest coefficient of variation (CV) of expression profile across all the samples was used for the clustering (see Additional file 3: Figures S1 and S2 for a series of dendrograms obtained by different CV cut-off points). The non-oncogenic melanocyte (N.Mel) and melanoma (T.Mel) cell lines were clustered together and separated into non-oncogenic and oncogenic groups in dendrogram A, whereas in dendrogram B, the N.HMEC samples were not grouped together and were clustered with the overall oncogenic group. N.HMEC is the normal breast cell line (human mammary epithelial cells) and T.MCF7 is the breast-cancer cell line MCF7.
