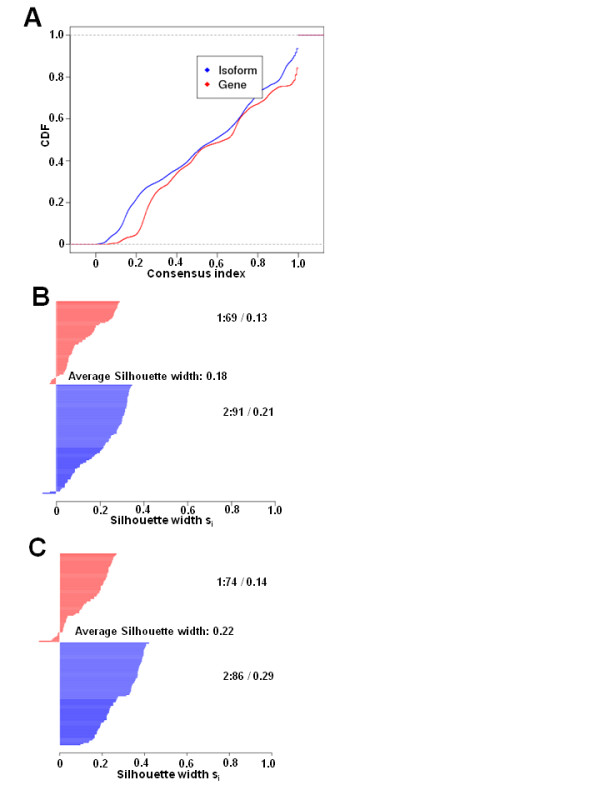
Figure 2.

Cumulative distribution function (CDF) and silhouette width plot demonstrates that isoform level clustering is more robust than gene-level clustering. (A) The empirical CDF plots were based on resampling 200 times at either isoform or gene level. (B, C) Silhouette width plots of the clustering results based on (B) gene-level expression of 27,063 genes and (C) isoform-level expression of 87,345 transcripts for the 160 datasets representing oncogenic and non-oncogenic cell lines. The stability and robustness of the clusters is indicated by average silhouette width. The sample number falling in each cluster and the silhouette width of each cluster is also represented on the figure.
