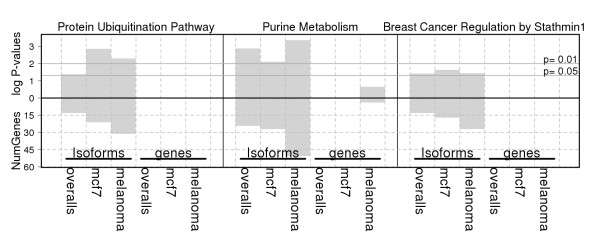
Figure 6.

Canonical pathways significantly enriched with genes that are differentially expressed at isoform level but not at gene level in three pairwise comparisons. 1) Overall: all oncogenic versus all non-oncogenic cell lines, 2) mcf: MCF7 versus HMEC, and 3) melanoma: melanoma cell -lines versus melanocytes. Number of genes and the log P values for each pathway are plotted in the lower and upper panels of the bar chart, respectively.
