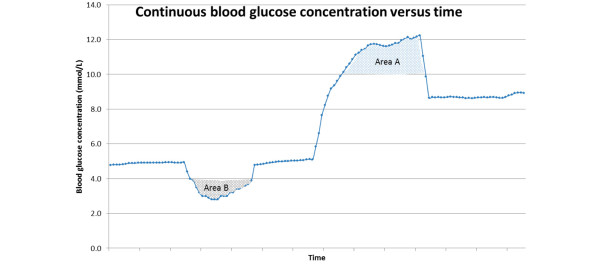
Figure 2.

Schematic representation of the performance of continuous blood glucose concentration. Area A, possible measure of hyperglycemia (when defined as blood glucose concentration >10.0 mmol/l). Area B, possible measure of moderate hypoglycemia (when defined as blood glucose concentration <4.0 mmol/l).
