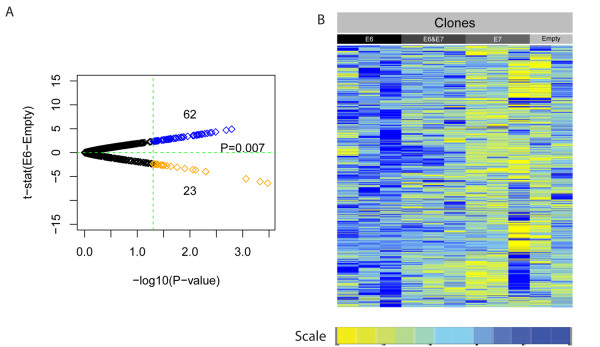
Figure 5.

Validation of consistent hypermethylated methylation variable positions (hyper-MVPs) in E6 and E6&E7 infected cell-line clones. (A) The formalin-fixed, paraffin wax-embedded (FFPE) hyper-MVP signature consistent with E6 (infected with E6 or E6&E7) versus empty vector controls (Monte Carlo P= 0.007). Volcano plot shows t-statistics of E6 versus empty clones plotted against log10 FFPE P values. (B) Heat-map representation of consistent hyper-MVPs in clones infected with E6, E6&E7, or E7 and empty vector controls. Yellow indicates relative hypomethylation in HPV+ samples and blue indicates hypermethylation (MVPs normalized across samples).
