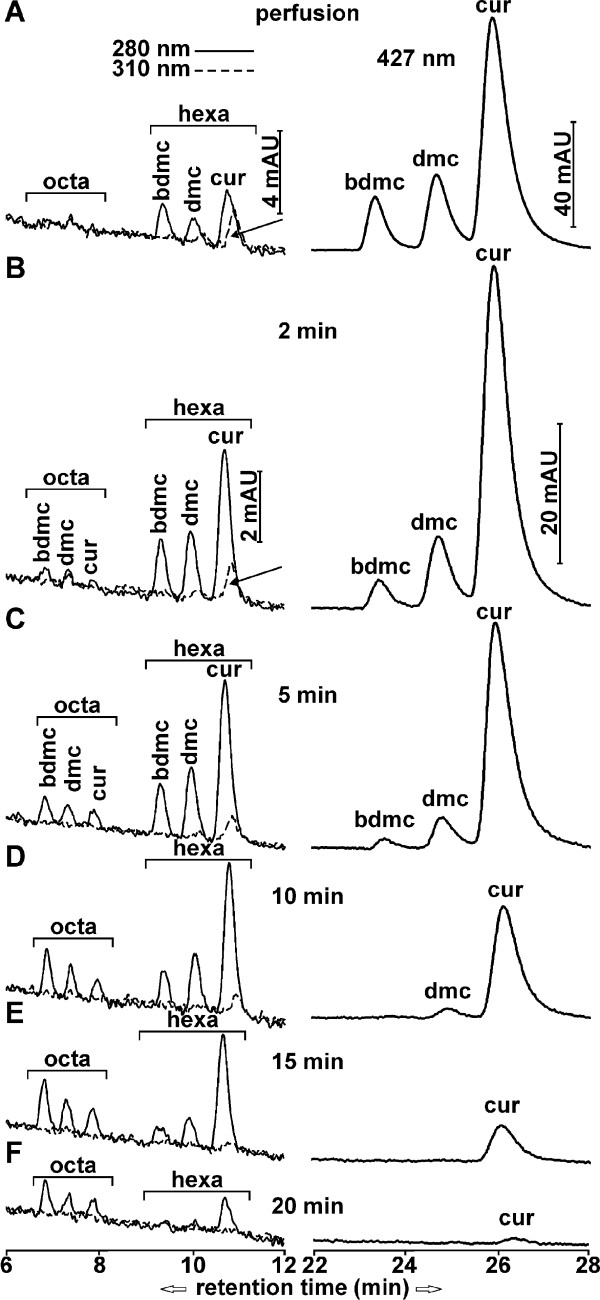
Figure 6.
Chromatograms of curcuminoids and reduction products in brain after cardiac perfusion and i.v. injection. Curcuminoids (right panels, retention time 22 to 28 minutes) were monitored at wavelength 427 nm and reduction products (left panels, retention time 6 to 12 minutes) at wavelengths 280 nm (solid lines) and 310 nm (dashed lines). The position of hexa- and octahydrocurcuminoids are indicated by brackets. (A) Elution profiles after cardiac perfusion. (B-F) Elution profiles at 2 minutes (B), 5 minutes (C), 10 minutes (D), 15 minutes (E) and 20 minutes (F) after i.v. injection.

