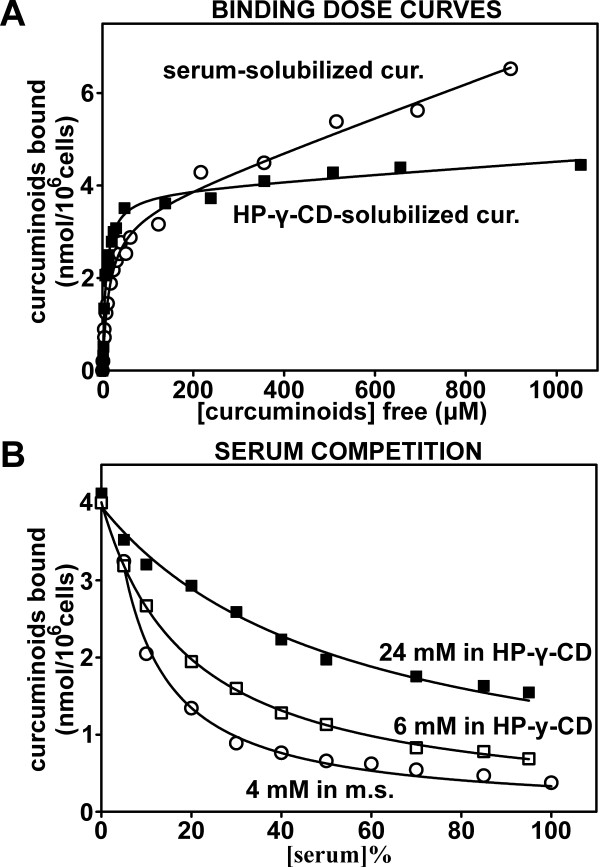
Figure 8.
The binding of curcuminoids solubilized in mouse serum or HP-γ-CD to NT2/D1 cells. (A) Binding dose curves of curcuminoids solubilized in either mouse serum (O) or 10%-γ-CD (■). NT2/D1 cells were incubated with increasing concentrations of curcuminoids and the concentration of unbound (free) and the amount of cellular bound curcuminoids was determined. From the resulting dose curves the following binding parameters were determined: KD: 14.87 ± 1.97 μM (O), 7.58 ± 0.92 μM (■); BMAX: 3.37 ± 0.15 nmol/106 cells (O), 3.87 ± 0.15 nmol/106 cells (■). (B) Binding dose curves with constant concentrations of curcuminoids added at a ratio of 1:20 (5%) to media containing variable serum concentrations (0 to 100%). Curcuminoids were solubilized in HP-γ-CD at a concentration of 24 mM (final concentration in medium: 1.2 mM; ■), diluted four-fold to 6 mM with 0.6% NaCl (final concentration in medium: 300 μM; □), or solubilized in mouse serum at 4 mM (final concentration in media: 200 μM; O). The data points were fitted to a hyperbolic decay function (y = ab/(b + x)).

