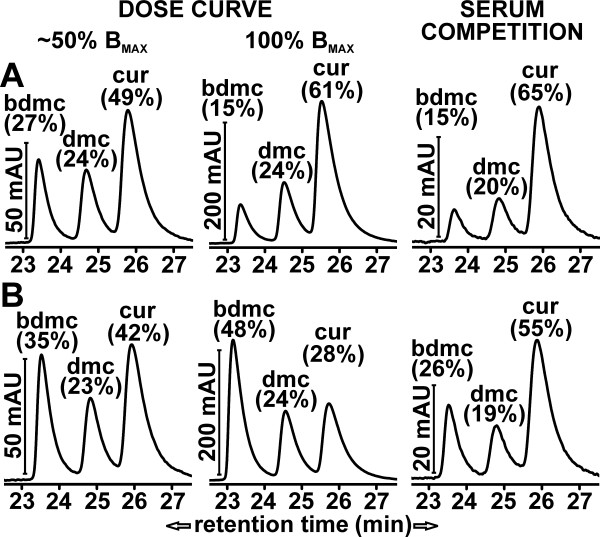
Figure 9.
Distribution of curcuminoids bound to NT2/D1 cells. (A) Distribution of mouse serum-solubilized curcuminoids bound to NT2/D1 cells. Left panel: Chromatogram of cells incubated with curcuminoid concentrations near the KD value (approximately 50% BMAX) obtained from the dose curve shown in Figure 8A (O). Middle panel: Chromatogram of cells incubated at saturating curcuminoid concentrations (≥ BMAX, 200 μM curcuminoids added to medium at a total of 5% serum). Right panel: Same as middle panel except that cells were incubated with 100% serum. The middle and right panels illustrate the starting and end points of the serum competition curve shown in Figure 8B (O). The relative contribution of each curcuminoid is indicated as a percentage of the total. (B) Distribution of HP-γ-CD-solubilized curcuminoids bound to NT2/D1 cells. Left panel: Chromatogram of cells incubated with curcuminoid concentrations near the KD value (approximately 50% BMAX) obtained from the dose curve shown in Figure 8A (■). Middle panel: Chromatogram of cells incubated at saturating curcuminoid concentrations (≥ BMAX, 300 μM curcuminoids added to medium without serum). Right panel: Same as middle panel except that cells were incubated with 95% serum. The middle and right panels illustrate the starting and end points of the serum competition curve shown in Figure 8B (□).

