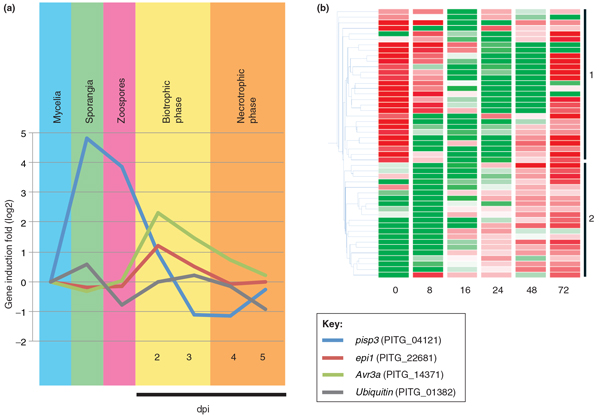
Figure 4.
Expression patterns of oomycete effector genes. (a) Expression profiles of two representative Phytophthora infestans effector genes in different developmental (mycelia, sporangia and zoospores) and infection (biotrophic and necrotrophic) phases. The life cycle of P. infestans begins with sporangia that are released and travel by wind to new host plants. Under suitable environmental conditions zoospores are released from the sporangium, germinate and penetrate the host plant to initiate infection. As a hemibiotroph, P. infestans undergoes a two-stage infection process, with an initial biotrophic phase followed by a later necrotrophic phase. The data correspond to P. infestans reference strain T30-4 and are based on [3], with expression during infection phases measured in potato. Gene induction values were normalized against the mycelia sample. epi1 encodes an apoplastic effector that functions as protease inhibitor [73] and Avr3a encodes a cytoplasmic RXLR effector [74]. Ubiquitin and pisp3 [75] are included as controls. dpi, days post-inoculation. (b) Crinkler (CRN) gene expression profiles during infection (reproduced from [47]). The heat map shows the expression pattern of full-length Phytophthora capsici CRN genes following tomato infection. Green is downregulated and red is upregulated compared with the median of each sample. Samples were collected at 0, 8, 16, 24, 48 and 72 hours post-infection. Gene classes with distinct expression profiles are indicated on the right.

