
Figure 3.
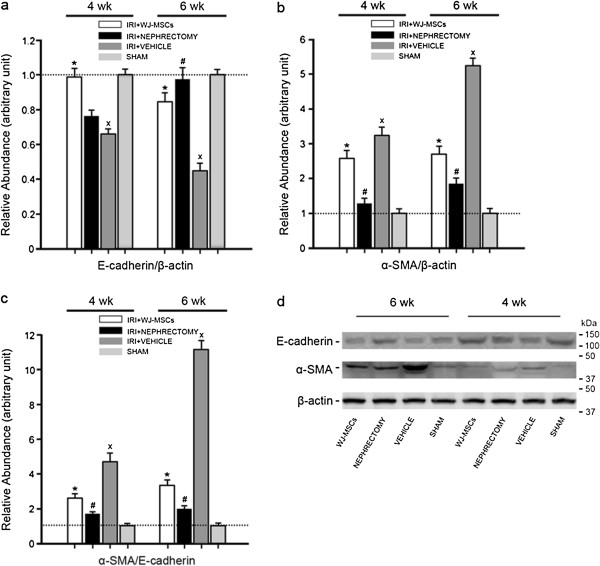
Densitometric analysis and gel photograph of E-cadherin and α-smooth muscle actin (SMA) expression in kidney tissues. Ischemic injury initiated the time-dependent upregulation of α-SMA/E-cadherin expression, indicative of the progression of EMT. This alteration was greatly prevented by cell treatment or intact kidney removal. The density of each band was determined. Values in the graph are expressed as densitometric ratios of E-cadherin/β-actin, α-SMA/β-actin, or α-SMA/E-cadherin as folds over control (sham-operated samples) (dotted line). Data are shown as mean ± SD of three kidney samples for each experimental condition. ∗P < 0.05, IRI+WJ-MSCs versus IRI+VEHICLE; #P < 0.01, IRI+NEPHRECTOMY versus IRI+VEHICLE; xP < 0.01, IRI+VEHICLE versus SHAM. (a) relative abundance of E-cadherin/β-actin; (b) relative abundance of α-SMA/β-actin; (c) relative abundance of α-SMA/E-cadherin; (d) gel photograph of E-cadherin, α-SMA, and β-actin protein expression.