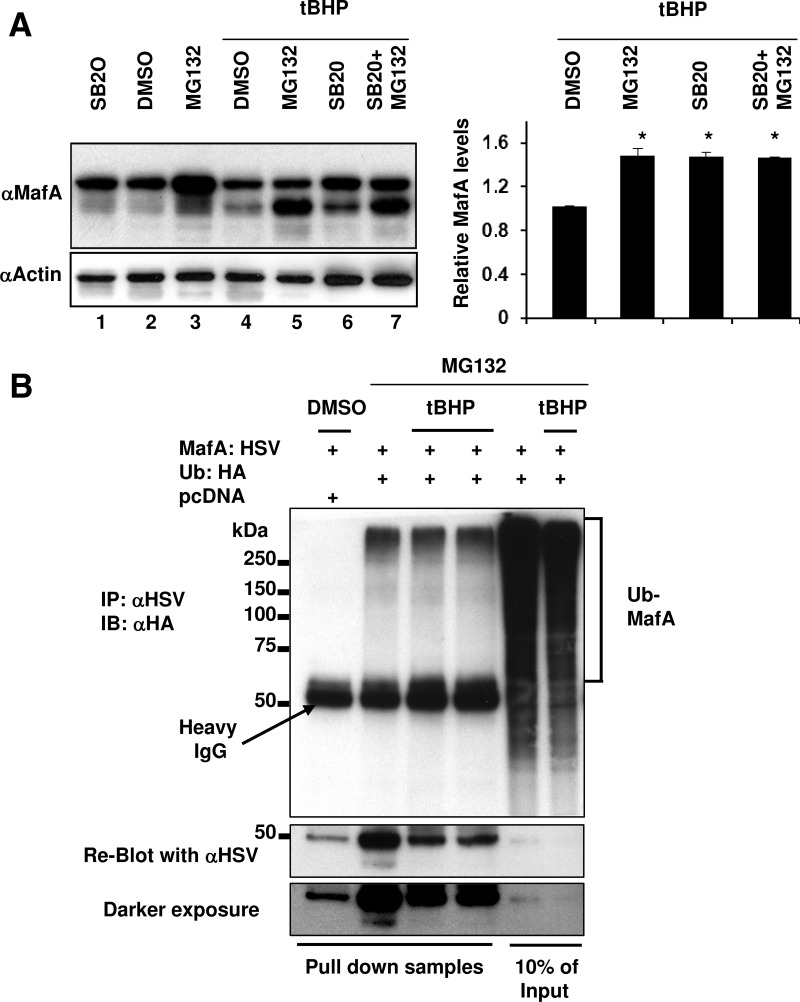
Figure 5.
Under oxidative stress p38 MAPK mediates MafA degradation through the proteasomal pathway. A, MIN6 cells were cultured in 0.8 mM glucose for the last 6 hours in the presence of indicated combination of DMSO, 20 μM SB203580 (SB20), and 10 μM MG132 in the presence or absence of 100 μM tBHP. Whole-cell extracts were subjected to immunoblots (IB) with α-MafA and α-actin antibodies. A representative gel from 3 independent experiments is shown. Graph on the right presents quantification of band intensity of endogenous MafA corresponding to lanes 4–7 from 3 independent experiments. The results are presented relative to the expression of MafA (normalized to the loading control, actin) as 1 ± SEM in MIN6 cells treated with DMSO in the presence of tBHP. *, P < .01. B, MIN6 cells cotransfected with pcDNA or MafA:HSV and Ub:HA expression plasmids were treated with a combination of DMSO, 10 μM MG132, and 100 μM tBHP for the last 6 hours in the presence of 0.8 mM glucose. Whole-cell extracts were immunoprecipitated (IP) with α-HSV antibody followed by immunoblotting with α-HA antibody. Whole-cell extracts from 2 independent experiments of MIN6 cells cotransfected with MafA:HSV and Ub:HA and treated with tBHP is shown. Reblot using α-HSV antibody is shown. A representative gel from at least 3 independent experiments is shown.

