Figure 2.
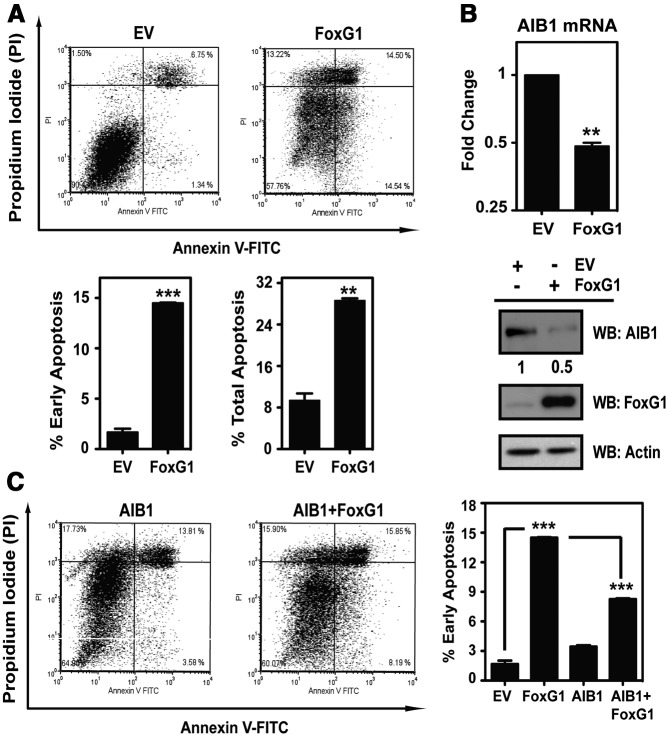
FoxG1 Induces Apoptosis and Down-Regulates AIB1 Expression in MCF-7 Cells. A, MCF-7 cells were transfected with either an EV control or FoxG1 constructs. Cells were subjected 24 hours after transfection to Annexin V apoptosis analysis. The percentages of cells in early and late apoptosis are represented by bottom right and top right quadrants of the FACS analysis, respectively. Percent total apoptosis was the total percentage of cells in both early and late apoptosis. The mean ± SEM values were obtained from duplicate samples from each transfection condition. ***, P < .001; **, P < .01 relative to EV. Statistical analysis was done by Student's t test. B, Analysis of endogenous AIB1 expression in MCF-7 cells overexpressing FoxG1. Cells were transfected with EV or FoxG1 as in panel A. Total RNA and whole-cell lysates were collected to determine the relative levels of mRNA and protein for AIB1. Cells transfected with EV were arbitrarily set at 1, and cells expressing FoxG1 were analyzed in reference to it. Student's t test. **, P < .01 relative to EV. Relative protein levels were determined by WB with antibodies as indicated. C, AIB1 rescues MCF-7 cells from FoxG1-induced apoptosis. MCF-7 cells were transfected separately with expression vectors for either EV control, FoxG1, AIB1, or AIB1 and FoxG1 together. Cells were assessed for apoptosis as in panel A. ***, P < .001, EV vs FoxG1; or FoxG1 vs AIB1+FoxG1. One-way ANOVA with Bonferroni posttest. FITC, fluorescein isothiocyanate.

