Figure 3.
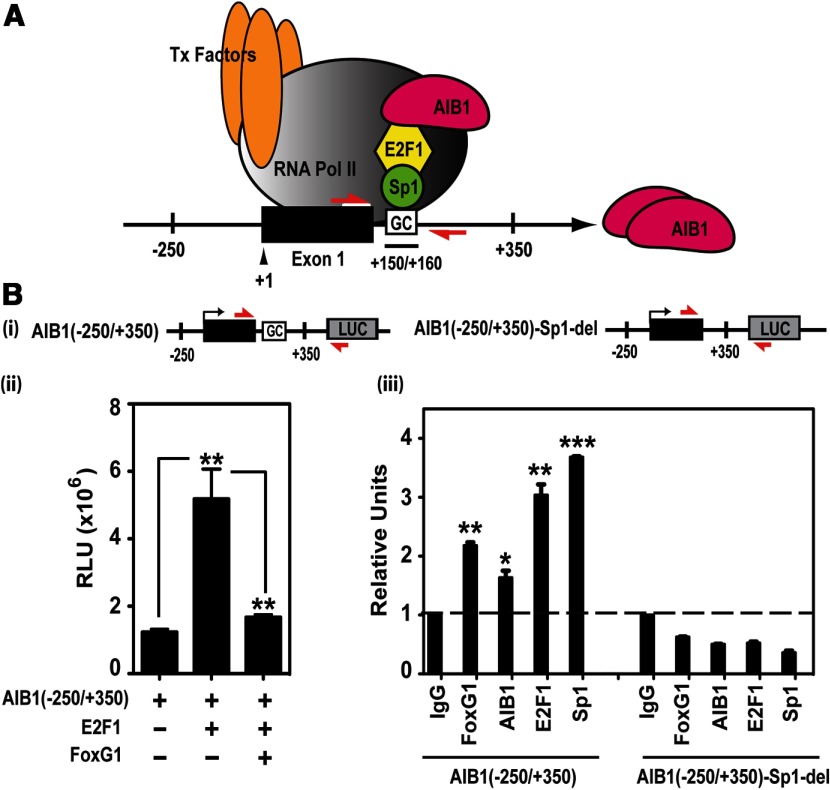
FoxG1 Represses AIB1 Gene Promoter Activity. A, Model of the AIB1 gene promoter. Model showing an activating transcriptional complex consisting of AIB1, E2F1, and Sp1, anchored to DNA through a Sp1-binding site, the GC box, which is downstream of exon 1 (black box) in the −250 to +350 bp region of the AIB1 promoter. The red arrows represent the locations and orientations of the AIB1 promoter-specific primers. B (panel i), AIB1 WT and mutant Sp1 site-deleted promoter luciferase reporters. The red arrows are primers that specifically detect these reporters. B (panel ii), FoxG1 represses the activity of the AIB1 promoter reporter. MCF-7 cells were transfected with WT AIB1 (−250/+350) reporter alone, or together with E2F1 in the presence or absence of FoxG1. A representative graph is shown from 2 independent experiments, and data were analyzed by 1-way ANOVA with Bonferroni posttest. **, P < .01 when E2F1 is compared with promoter alone; or FoxG1 and E2F1 together relative to E2F1. B (panel iii), Protein association to the Sp1-binding site in the transfected AIB1 gene promoter. HEK293T cells were transfected with either the WT AIB1 reporter or the mutant reporter where the Sp1-binding sequence is deleted. Cells were processed for ChIP 6 hours after transfection. Recruitment of FoxG1, AIB1, E2F1, and Sp1 to both the WT and mutant reporters was assessed with a pair of primers that specifically detect the transfected reporter DNA (panel i, red arrows). The IgG-ChIP was arbitrarily set as 1, and all the samples were analyzed and plotted in reference to IgG. Data represent 2 independent experiments and were analyzed by Student's t test. ***, P < .001; **, P < .01; *, P < .05 compared with IgG control.

