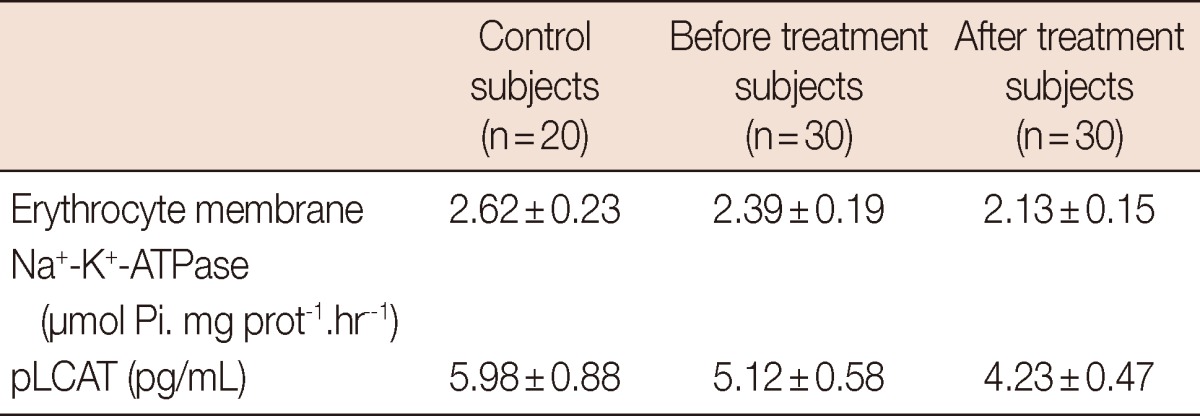
Table 2.
Levels of erythrocyte membrane Na+-K+-ATPase activity and pLCAT activity in control and patients groups

Data are presented as mean±SD. Comparisons are made between control and breast cancer subjects. p<0.001 vs. control group and before treatment. p<0.001 vs. control group and after treatment. p<0.001 vs. after treatment and before treatment.
pLCAT=plasma lecithin:cholesterol acyltransferase.
