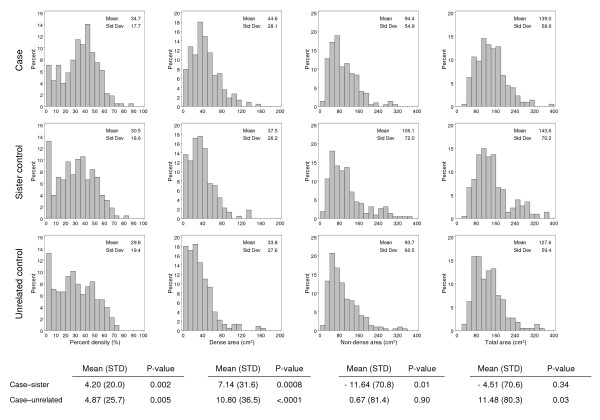
Figure 1.
Distribution of percent mammographic density, dense area, non-dense area and total area for cases, sister controls, and unrelated controls. Shown are the means of the differences between cases and sister controls, and cases and unrelated controls. P is a P value from the paired t-test, two-sided.

