
Figure 1.
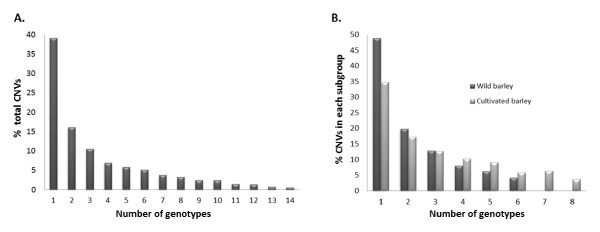
Frequency spectrum of CNV. (A) Percentage of CNVs identified in one to 14 genotypes relative to the total number of events; (B) frequency spectra comparison between wild and cultivated barley.
Official websites use .gov
A
.gov website belongs to an official
government organization in the United States.
Secure .gov websites use HTTPS
A lock (
) or https:// means you've safely
connected to the .gov website. Share sensitive
information only on official, secure websites.
Frequency spectrum of CNV. (A) Percentage of CNVs identified in one to 14 genotypes relative to the total number of events; (B) frequency spectra comparison between wild and cultivated barley.