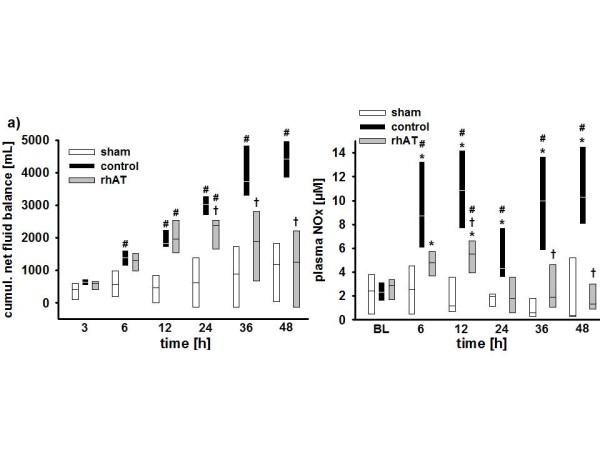
Figure 3.

Cumulative net fluid balance (a) and concentration of NOx in the plasma (b). *P <0.05 vs. baseline; #P <0.05 vs. sham; † P <0.05 vs. control; data are represented as box plots with median and interquartile range (25th; 75th); n = 6 per group. BL, baseline; NOx, nitrates and nitrites; rhAT, recombinant human antithrombin III.
