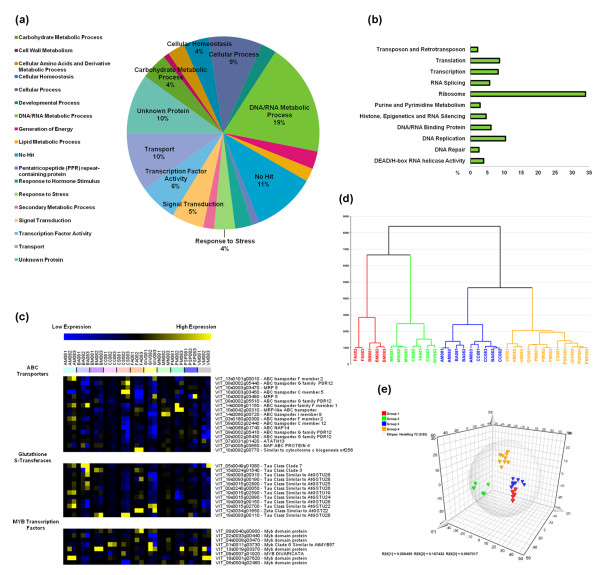
Figure 3.
Grapevine transcripts showing plasticity during berry development. (a) Functional category distribution of the 1,478 (P <0.01) plastic grapevine genes. Transcripts were grouped into the 18 most represented functional categories, based on Plant GO Slim classification of biological processes. (b) Plant GO Slim classification of biological processes and functions for 280 transcripts in the 'DNA/RNA Metabolic Process' category. (c) Plastic members of the ABC transporter, glutathione-S-transferase, and MYB transcription factor gene families. The heat map of transcriptional profiles was generated with TMeV 4.8 using the average expression value of the three biological replicates. Sample names are composed by vineyard abbreviation followed by the indication of the harvesting year (08) and by the indication of the developmental stages (1, 2, or 3). (d) Principal component analysis using Simca P+ 12.0 (Umetrics). The PCA dendrogram was calculated using the average expression value of the three biological replicates. The dendrogram was designed using Ward's method and horizontally sorted by cluster size. Sample names are composed by vineyard abbreviation followed by the indication of the harvesting year (08) and by the indication of the developmental stages (1, 2, or 3). (e) Variables and scores three-dimensional scatter plot of the O2PLS-DA model (3+2+0, UV, R2X = 0.673, Q2 = 0.775) applied to the 1,478 plastic transcripts dataset and colored according to the four-group partition as in the PCA analysis shown in (d). The model was created using Simca P+ (12.0). Components 3 and 2 represent the predictive and orthogonal components identified by the model, whereas 0 represents the background variation. UV: Unit variance scaling method.

