
Figure 2.
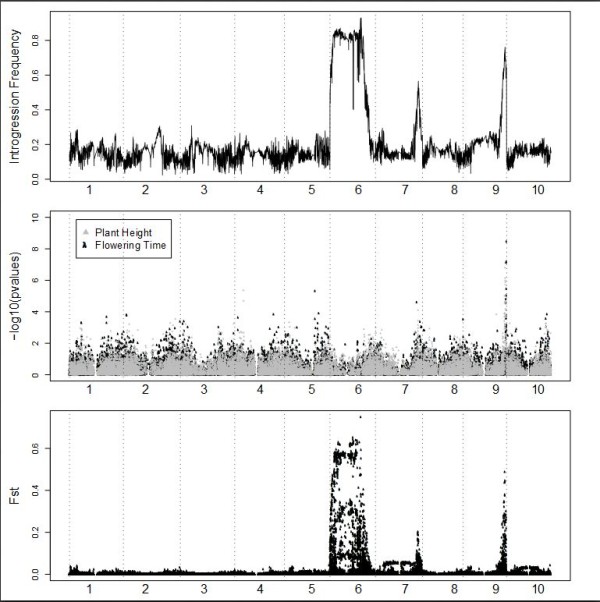
Genome-wide analysis of temperate adaptation in sorghum. The x axis in each panel represents physical distance along the ten sorghum chromosomes. The top panel shows introgression frequency in a set of 390 SC-EP pairs with <10% unexpected genotypes (see Methods for calculation). The middle panel shows phenotypic associations with plant height and flowering time in the full set of 580 genotyped SC lines. The bottom panel shows population differentiation (Fst) between the full sets of 580 SC lines and 580 EP lines.