
Figure 4.
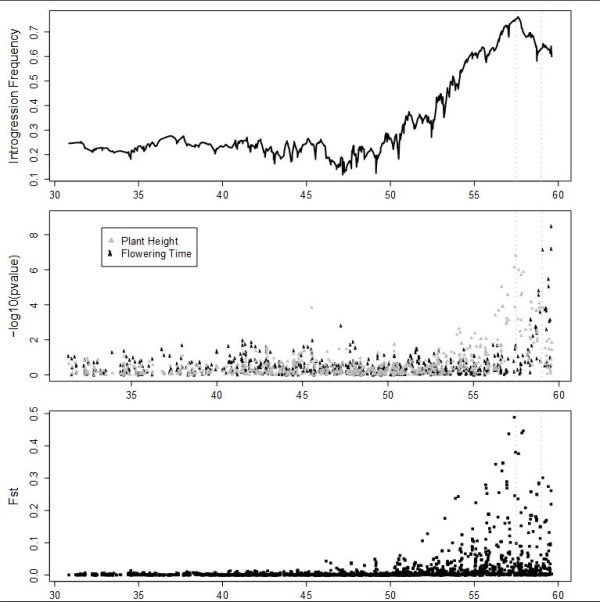
Introgression frequency, phenotypic associations, and population differentiation in the Dw1 region on sorghum chromosome 9. Panels are the same as in Figures 2 and 3. The locations of putative QTL for plant height and maturity are shown with vertical dashed gray lines.