
Figure 5.
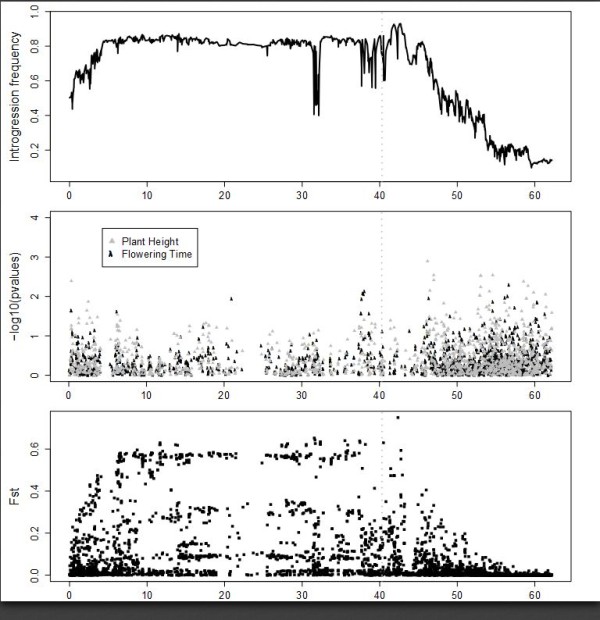
Introgression frequency, phenotypic associations, and population differentiation on sorghum chromosome 6. Panels are the same as in Figures 2 to 4. The location of Ma1 at 40.3 Mb is shown with a vertical dashed gray line.
Official websites use .gov
A
.gov website belongs to an official
government organization in the United States.
Secure .gov websites use HTTPS
A lock (
) or https:// means you've safely
connected to the .gov website. Share sensitive
information only on official, secure websites.
Introgression frequency, phenotypic associations, and population differentiation on sorghum chromosome 6. Panels are the same as in Figures 2 to 4. The location of Ma1 at 40.3 Mb is shown with a vertical dashed gray line.