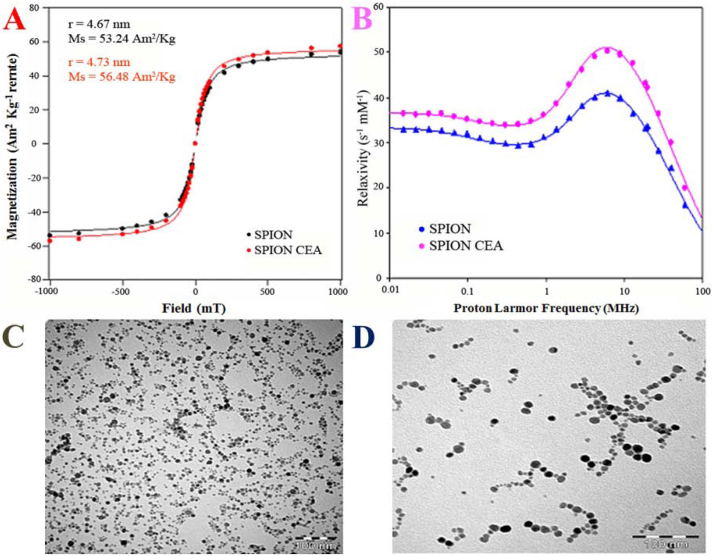
Figure 2. Magnetization curves, NMRD profiles, and Transmission Electron Micrographs of bare and CES-grafted SPIONS.
(A) Magnetization curves for bare and CES-grafted SPIONs, (B) NMRD profiles of bare and CES-grafted SPIONs, and Transmission Electron Micrographs of (C) bare and (D) CES-grafted SPIONs.

