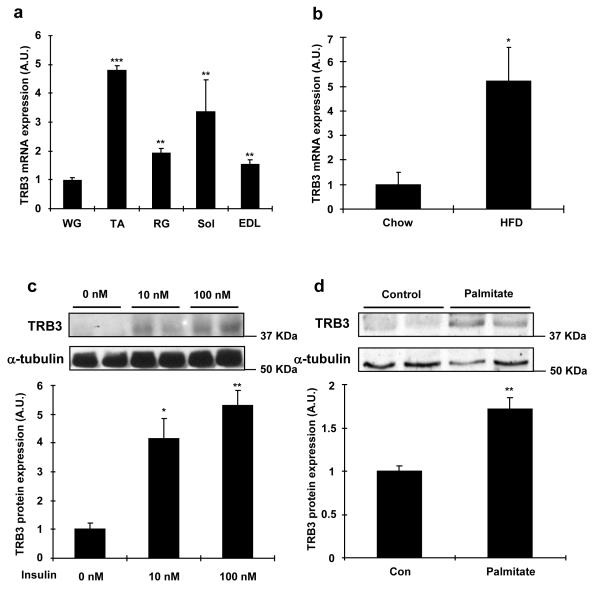
Fig. 1. Regulation of TRB3 expression in C2C12 cells and mouse skeletal muscle.
(a) Female ICR mice (12 weeks old) were sacrificed by cervical dislocation and white gastrocnemius (WG), tibialis anterior (TA), red gastrocnemius (RG), soleus (Sol), and extensor digitorum longus (EDL) muscles were dissected and frozen. Real-time PCR was performed to determine mRNA expression of TRB3 in multiple muscles (n=3). (b) Male C57BL/6 mice (8 weeks old) were fed a high fat diet for 6 weeks. TA muscle was dissected to determine mRNA expression of TRB3 (n=6). (c-f) C2C12 cells were differentiated for 6 days and incubated with 0, 10, or 100 nM of insulin (c); 0 or 0.75 mM palmitate (d) with 2% BSA for 16 hrs, and protein extracts were used for Western blot analysis to determine TRB3 expression as described in the Experimental Procedures (n=4). Additional myotubes were preincubated with DMSO (0.1% v/v), PI3 kinase inhibitor (100 nM; Wortmannin from Sigma), or Akt inhibitor (10 μM; Akt inhibitor VIII from EMD) 30 min prior to incubation with 0 or 100 nM of insulin (e); with chemical chaperones (5 mM; 4-phenyl butyric acid, PBA from Sigma or 0.5% v/v: DMSO) 30 min prior to incubation with 0 or 0.75 mM palmitate (f) for 16 hrs to determine mRNA expression of TRB3, GRP78, and Chop (n=3). (g) TRB3 Western blot analysis of vastus lateralis muscle from lean, obese, or diabetic subjects (n=6-13). Data are the means ± S.E.M. * indicates p<0.05, ** indicates p<0.01, and *** indicates p<0.001 vs. WG muscle or control. # indicates p<0.05, ## indicates p<0.01, and ### indicates p<0.001 vs. corresponding control, using One way ANOVA (a,c,g), Student’s t-test (b,d), and Two way ANOVA with Bonferroni correction (e,f).


