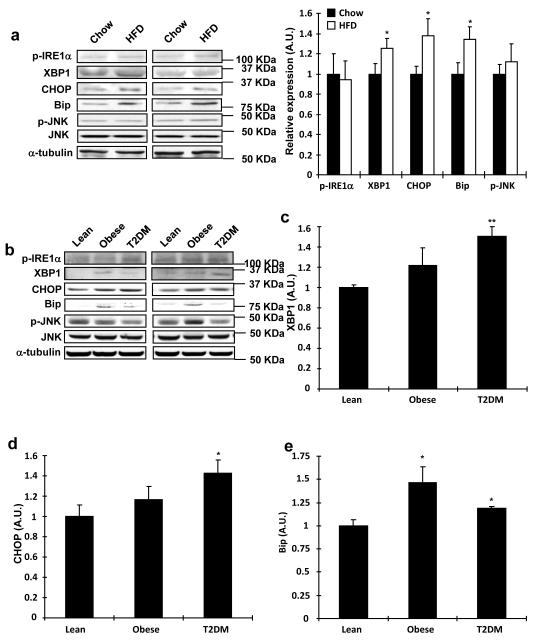
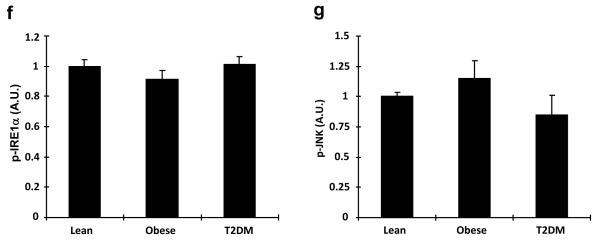
Fig. 3. Expression of ER stress markers in mouse and human skeletal muscle.
(a) TA muscle lysates from high fat fed mice were used to determine the expression of ER stress markers by Western blot analysis (n=6). (b-g) Western blot analysis was done to measure proteins involved in ER stress in vastus lateralis muscle from lean, obese, or diabetic subjects (n=6-13). Data are the means ± S.E.M. * indicates p<0.05 and ** indicates p<0.01 vs. chow or lean controls, using Student’s t-test (a) and One way ANOVA.


