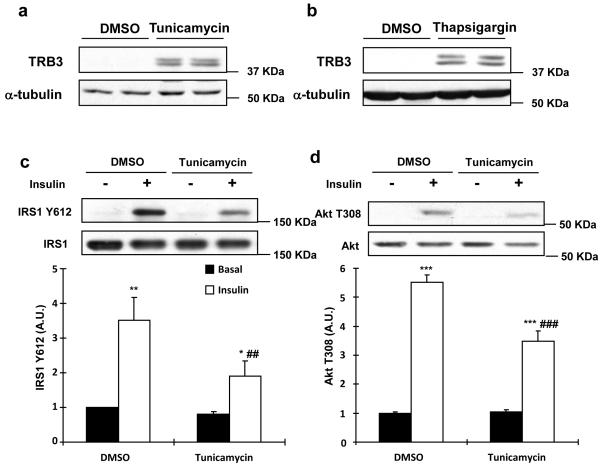
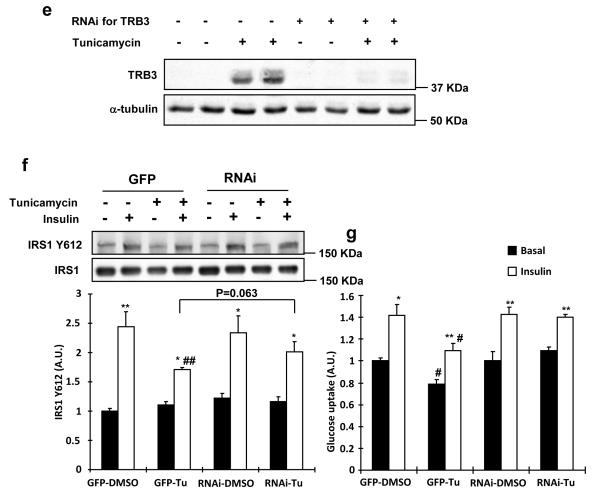
Fig. 4. Effects of ER stress and TRB3 in insulin signaling and glucose uptake in C2C12 cells.
(a,b) C2C12 myotubes were incubated with ER stressors, tunicamycin (1 μg/ml; A) or thapsigargin (1.3 μg/ml; B), for 4 hrs. Lysates were subjected to Western blot analysis to determine TRB3 expression. (c,d) C2C12 myotubes were incubated with tunicamycin for 4 hrs followed by 100 nM of insulin for 10 min. Insulin-stimulated IRS1 tyrosine phosphorylation at 612 (c) and Akt phosphorylation at threonine 308 (d) were determined by Western blot analysis (n=4). (e-g) C2C12 myotubes were infected with adenovirus containing RNAi for TRB3. (e) ER stress-induced TRB3 expression was determined by Western blot analysis. Cells were incubated in the presence or absence of tunicamycin to determine IRS1 Tyr612 phosphorylation (f) and glucose uptake (g) upon insulin stimulation (100 nM) (n=6). Data are the means ± S.E.M. * indicates p<0.05, ** indicates p<0.01, and *** indicates p<0.001 vs. basal in the same group. # indicates p<0.05, ## indicates p<0.01, and ### indicates p<0.001 vs. corresponding control, using Two way ANOVA with Bonferroni correction.


