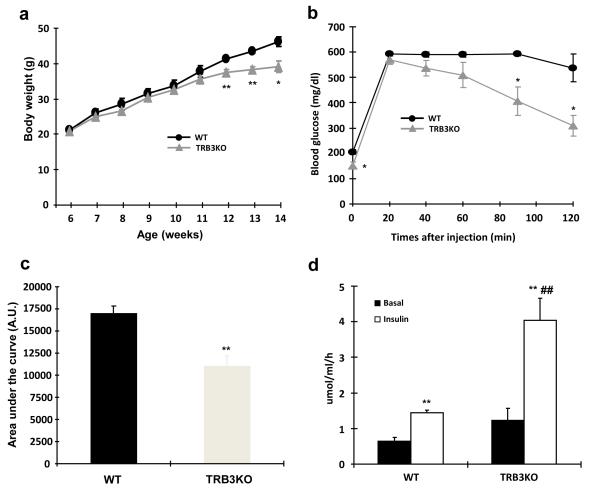
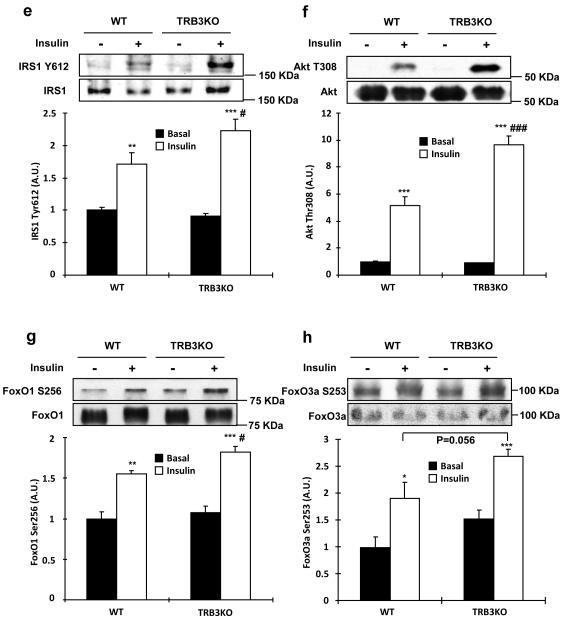
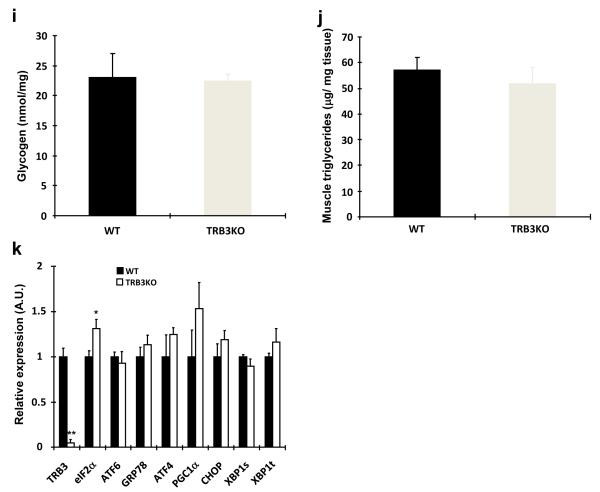
Fig. 6. Metabolic consequences of a high-fat diet inTRB3 knockout mice.
(a-k) Wild type and TRB3 knockout mice at 6 weeks of age were placed on a high fat diet for 8 weeks. (a) Body weights of male mice were tracked every week for 8 weeks during the high fat diet. The TRB3 knockout mice showed lower body weight compared to wild type mice. (b,c) Mice were fasted for 14 hours to perform glucose tolerance test. The TRB3 knockout mice had lower fasting blood glucose concentration (b), improved glucose tolerance (b), and lower area under the curve during the glucose tolerance test (c). (d-k) Mice were fasted for 14 hours and killed to determine insulin-stimulated glucose uptake from soleus muscles (d), insulin-stimulated phosphorylation of IRS1 (e), Akt (f), FoxO1 (g), and FoxO3a (h) in EDL muscles, and glycogen in TA muscles (i), triglycerides from gastrocnemius muscles (j), and mRNA expression of ER stress markers from TA muscles (k). Data are the means ± S.E.M., n=3-6/group. * indicates p<0.05, ** indicates p<0.01, and *** indicates p<0.001 vs. wild type or basal in the same group. # indicates p<0.05, ## indicates p<0.01, and ### indicates p<0.001 vs. corresponding control in the wild type, using Student’s t-test (a,b,c,k) and Two way ANOVA with Bonferroni correction (d,e,f,g,h).


