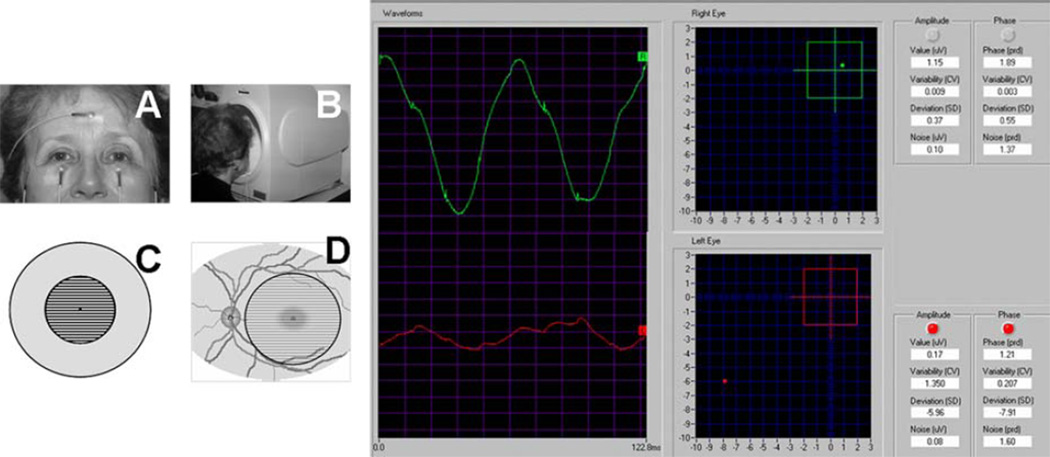
Fig. 1.
The steady-state PERG is recorded from skin electrodes in response to fine horizontal bars reversing 16.28 times per second. The pattern stimulus covers a circular area of 25 degrees diameter centered on the fovea. A normal PERG waveform has a sinusoidal-like shape (green tracing) that is automatically analyzed in its amplitude and phase. Amplitude and phase are also expressed as SD deviations from age-predicted normal values. The red tracing is an example of abnormal PERG in glaucoma. Note the reduced amplitude and the delayed phase

