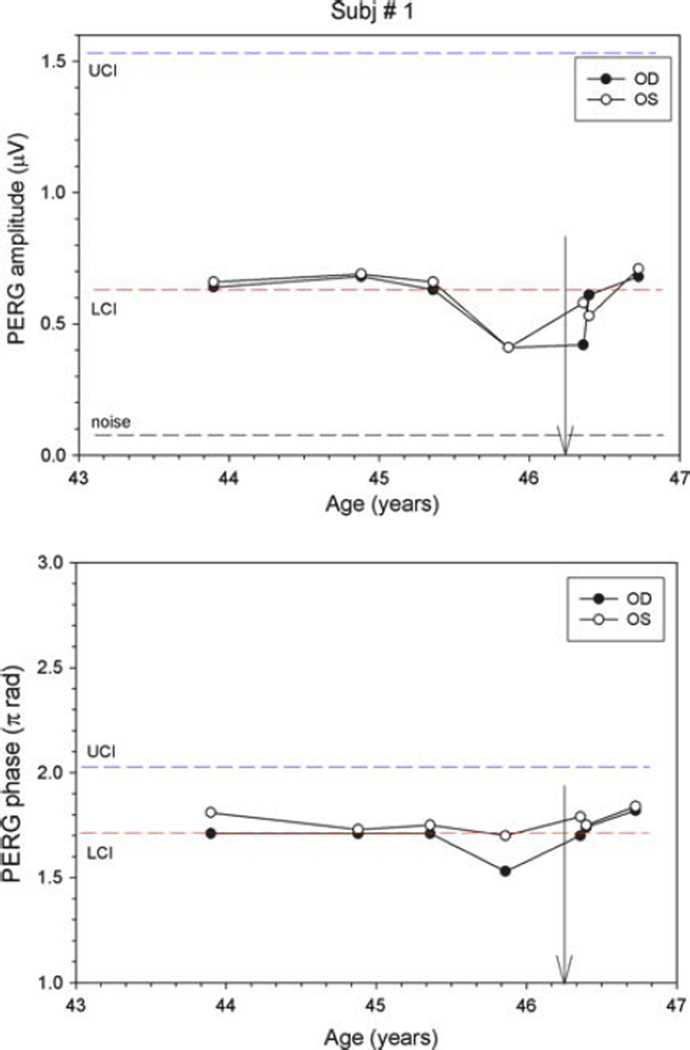
Fig. 2.
PERG amplitude (upper panel) and phase (lower panel) at different ages for subject #1. LCI (red dashed lines) and UCI (blue dashed line) represent the lower and upper confidence intervals, respectively, for age-matched normal population. The black dashed line represents the noise amplitude, obtained by recording a response with the stimulus occluded. Vertical arrows on the x axis represent subject’s age at the time of surgery

