
Figure 3.


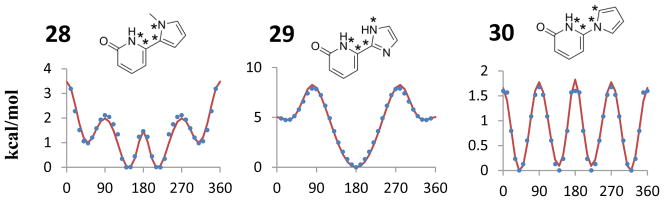
Structures and torsional energy profiles for the indicated dihedral angles of biaryls 1–30. Blue dots represent the MP2 single point energies and the red solid lines are the OPLS/CM1A energy profiles obtained using the new parameters. The four starred atoms indicate the dihedral angle for which the relative energies are plotted.