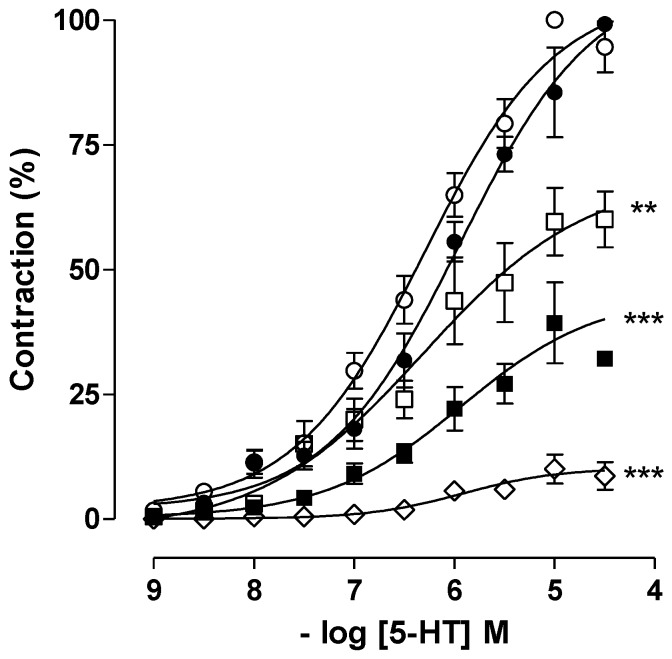
Figure 3.
Cumulative concentration-response curves for 5-HT in the absence (○) and presence of caulerpine: 3 × 10⁻⁵ (●), 10−4 (□), 3 × 10⁻⁴ (■) and 10−3 M (◇) (n = 5). Symbols and vertical bars represent the means and S.E.M., respectively. One-way ANOVA followed by Bonferroni’s test, significant differences are indicated by ** p < 0.01 and *** p < 0.001.

