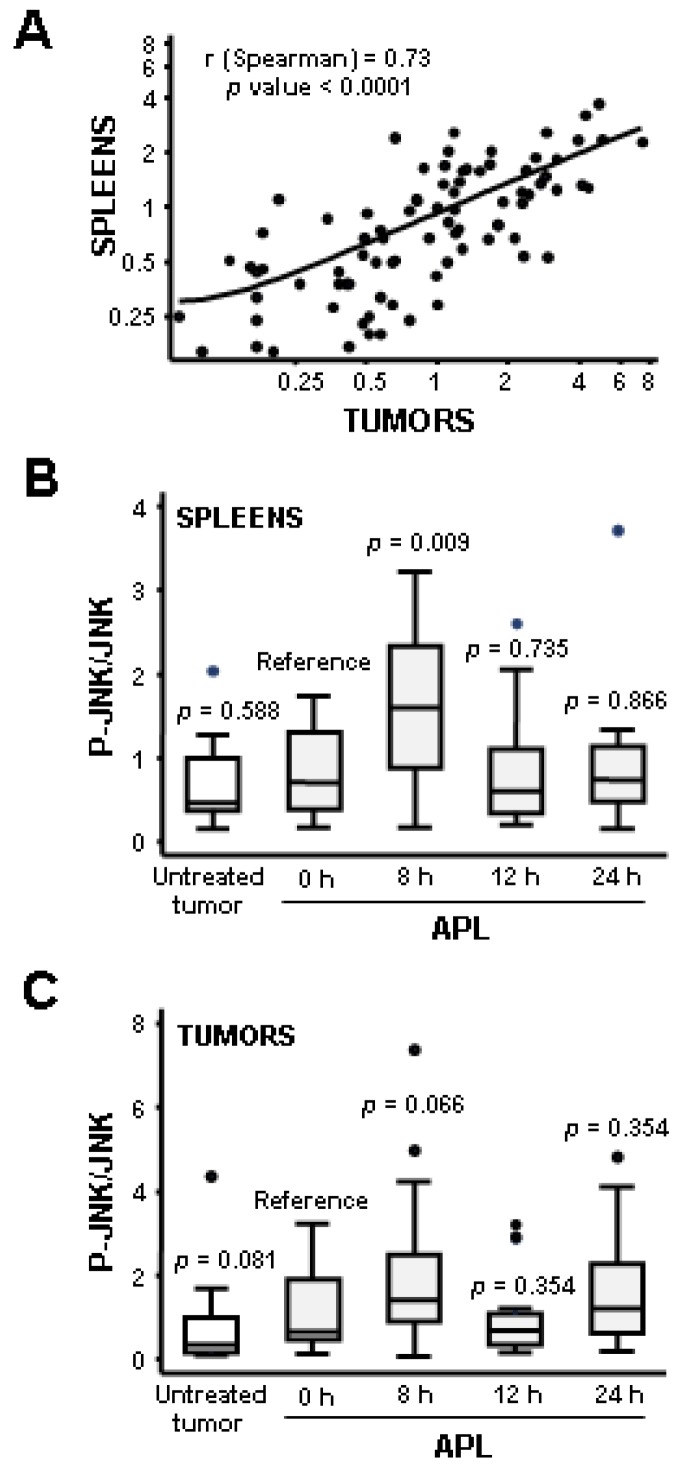
Figure 4.
Statistical analysis of JNK activation by plitidepsin in tumors and spleens from mice xenografted with K562 leukemia cells. (A) Relation between the activation of JNK in tumors and spleens of K562 bearing-mice after plitidepsin administration. Samples corresponding to mice untreated and treated with plitidepsin (200 μg/kg) for 0, 8, 12 or 24 h were pooled. p-JNK/total JNK ratios in tumors and spleens were calculated and their correlation statistically assessed following a non-parametric approach. The Spearmans correlation coefficient (r) and p value are shown. (B, C) Box-plot of JNK activation in tumors and spleens of K562 bearing-mice after plitidepsin administration. The p-JNK/JNK ratio in spleens (B) and tumors (C) at each time point was compared to that of mice that were sacrificed just after plitidepsin injection (0 h) using Wilcoxon rank-sum test. A box-plot of JNK activation in each group (18–20 mice/group) and its statistical significance (p) are presented. Boxes in the plot include values in the 25%–75% interval; internal lines represent the median.

