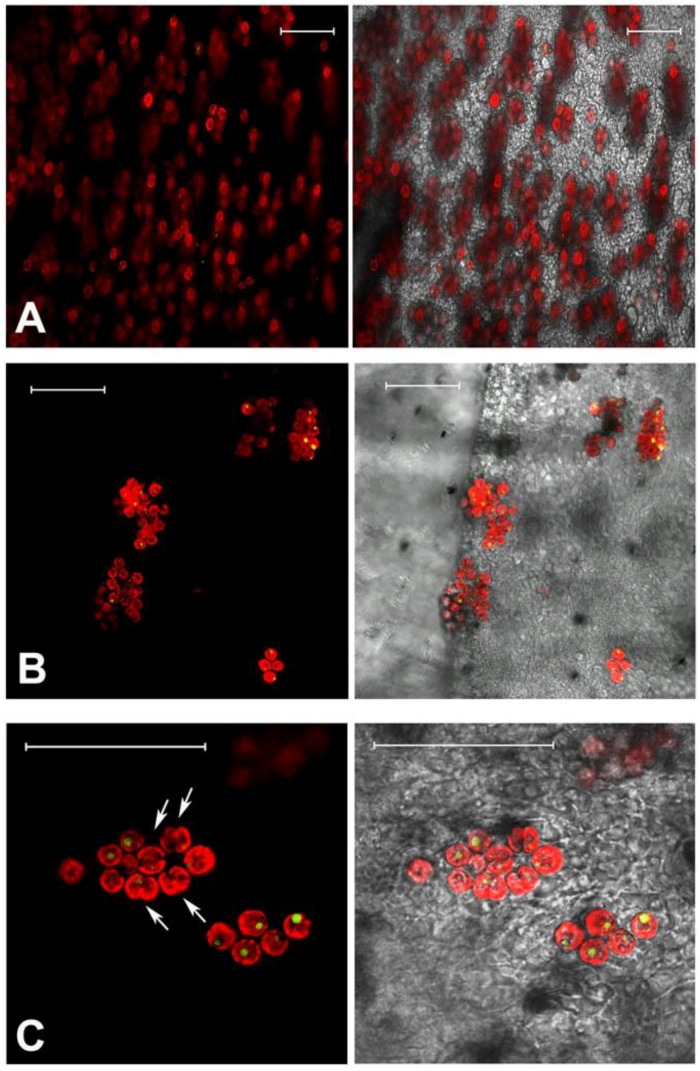
Figure 2.
Confocal microscopy images of C. tuberculata tissues showing auto-fluorescence from zooxanthellae. Tissue samples from the frilled edges of oral arms (A); and umbrella (B); Magnification showing peripheral red auto-fluorescence of the chloroplast, green-fluorescence in the single vacuole and several dividing cells (doublet, arrowed) (C). Images are the merge of false-colored red and green autofluorescence emission (on the left), and the merge of red, green fluorescence and transmitted light (or bright field) picture (on the right). Bars = 50 μm.

