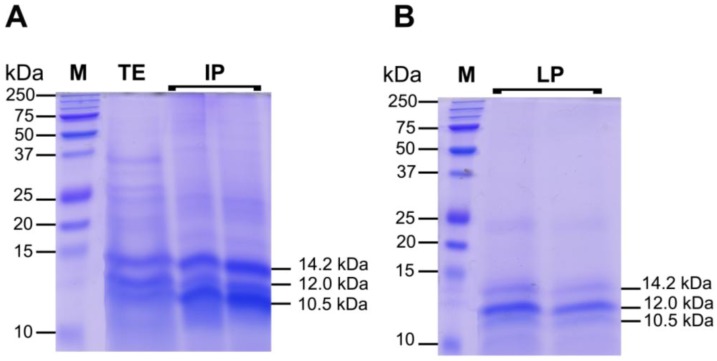
Figure 8.
Polypeptide patterns, separated by 12% reducing SDS-PAGE, of 25 μg of total hydro-alcoholic extract before ACN precipitation (TE), and 25 μg of Intermediate phase (IF) (A), and Lower phase (LP) (B) of the extract after ACN precipitation. The molecular weight size marker (lane 1, M), in the range of 250–10 kDa, was run in parallel with samples for molecular weight estimation. Protein bands were visualized by staining gels with Coomassie R-250 dye.

