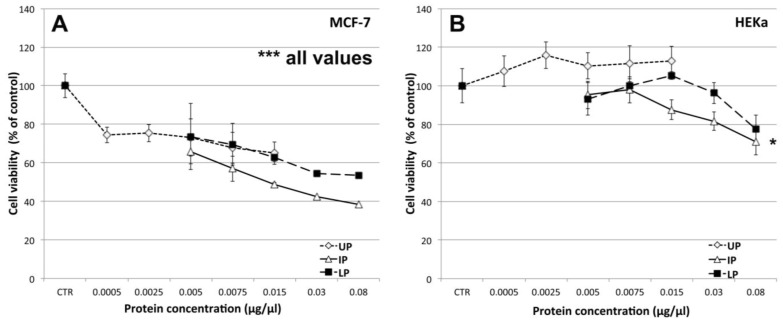
Figure 9.
Effect of different concentrations of the three C. tuberculata extract fractions on the viability of MCF-7 (A) and HEKa (B) cells evaluated by the MTS assay. UP, Upper phase; IP, Intermediate Phase; LP, Lower Phase.Data are expressed as percentage of the control and represent the mean ± SD of three independent experiments (n = 12). * p ≤ 0.05; *** p ≤ 0.01. In A, p ≤ 0.01 for all values.

